
The Voice Focus Section allows you to analyze in detail the Media strategy by Voice, in terms of MIV & Placements.
Example: How much a specific Voice generated in terms of MIV ?
You need to select the Period (e.g. from 01/01/23, to 31/03/23) and the Voice (e.g. Media: Grazia - IT or Influencer: Danielle Marcan, etc.) and eventually the Brands.
Note: The Media Voice takes into account all the channels of a media (e.g. Vogue: print magazine + online magazine + social media account).
Please find below the data available in this section (all the graphs are clickable):
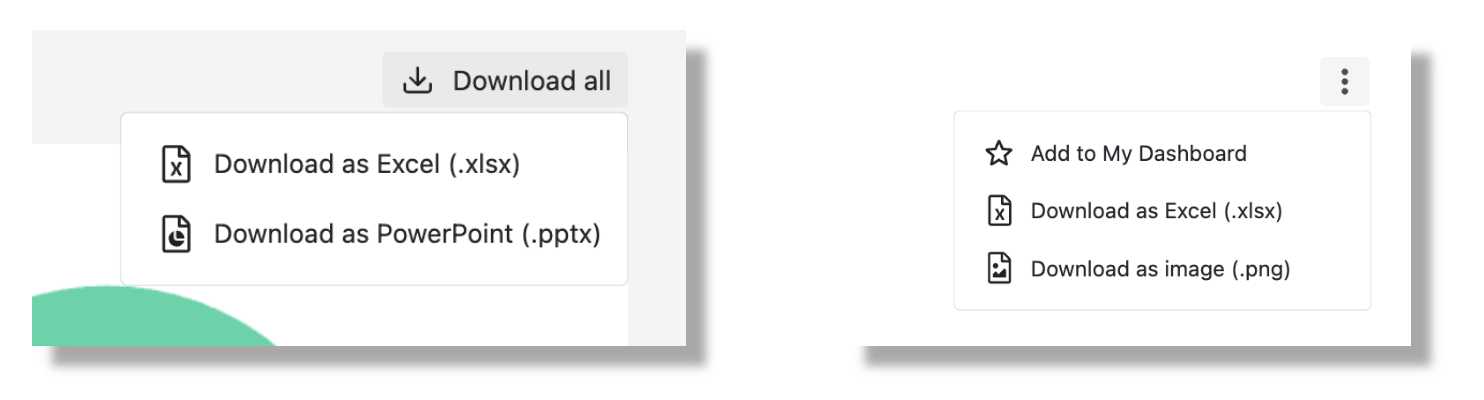
Note: You can download all the graphs in just one click as Excel or Power Point, or download each graph as Excel or Image.
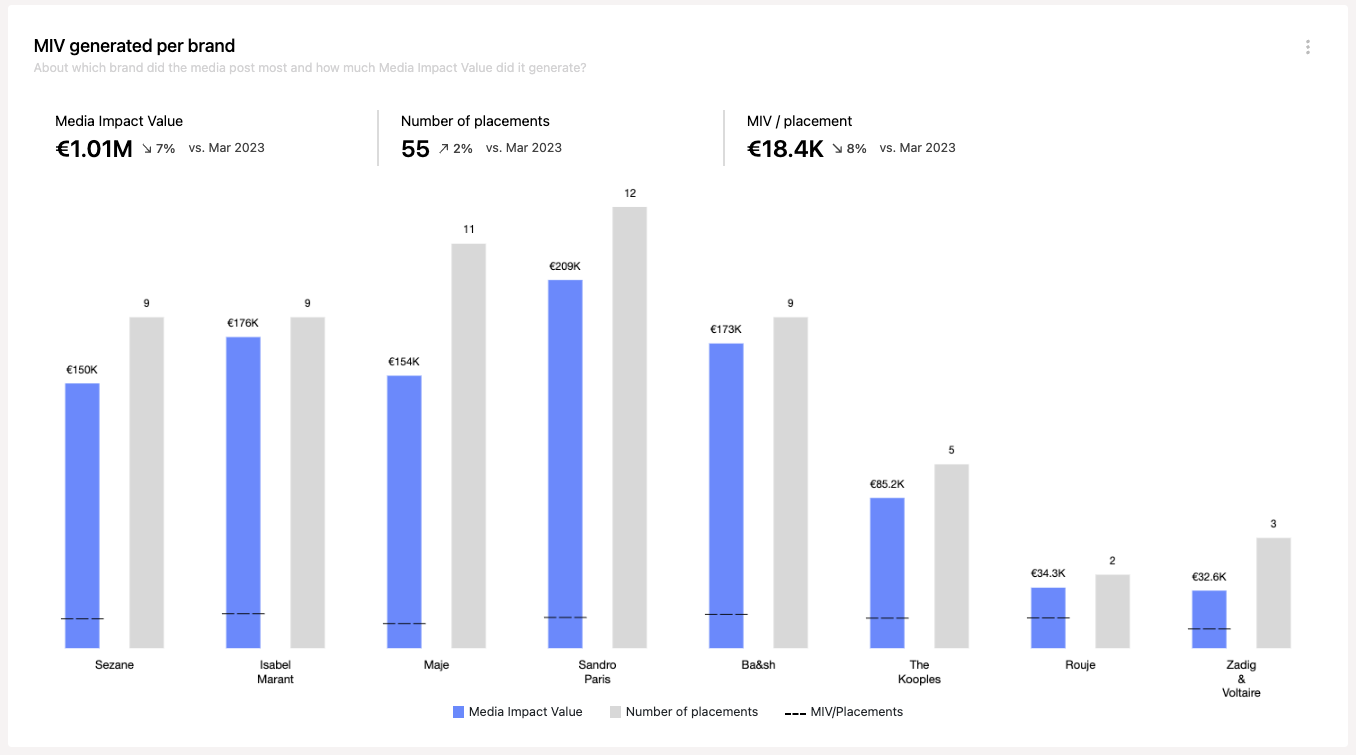
- The MIV generated by brand, considering the period and the Voice selected.
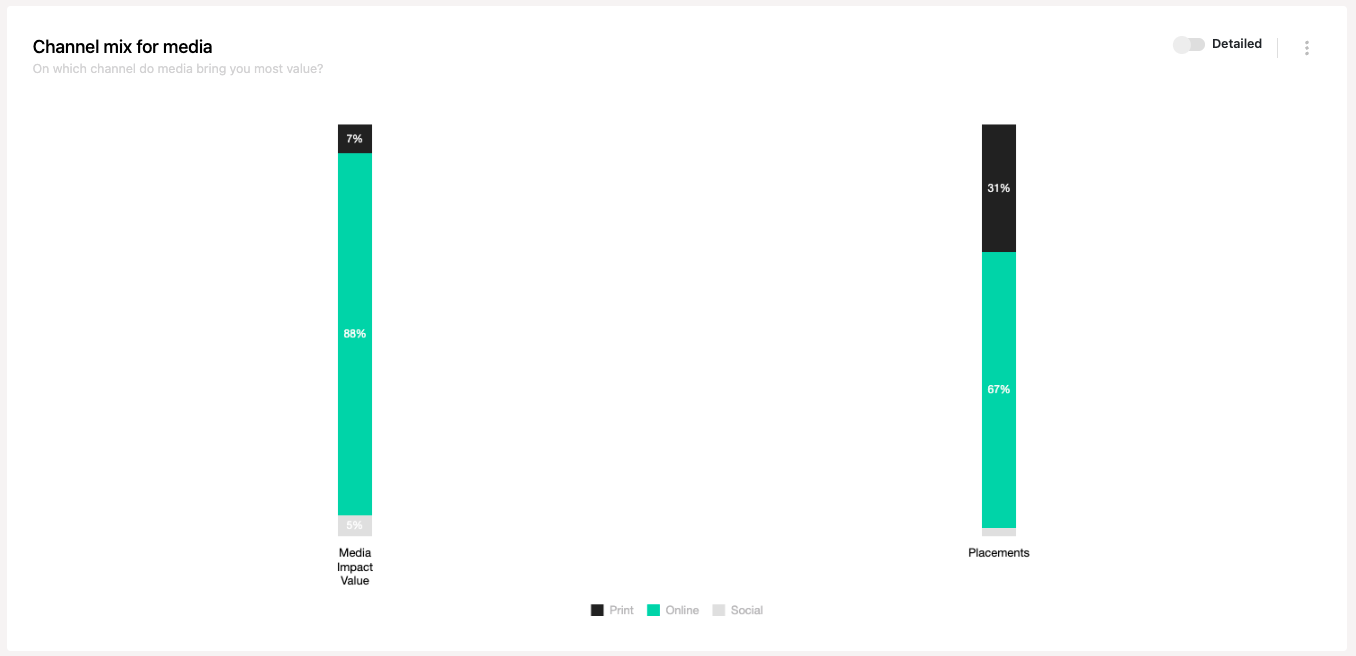
- The Channel (Print, Online, Social) of the selected Voice that brought more MIV (in percentage).
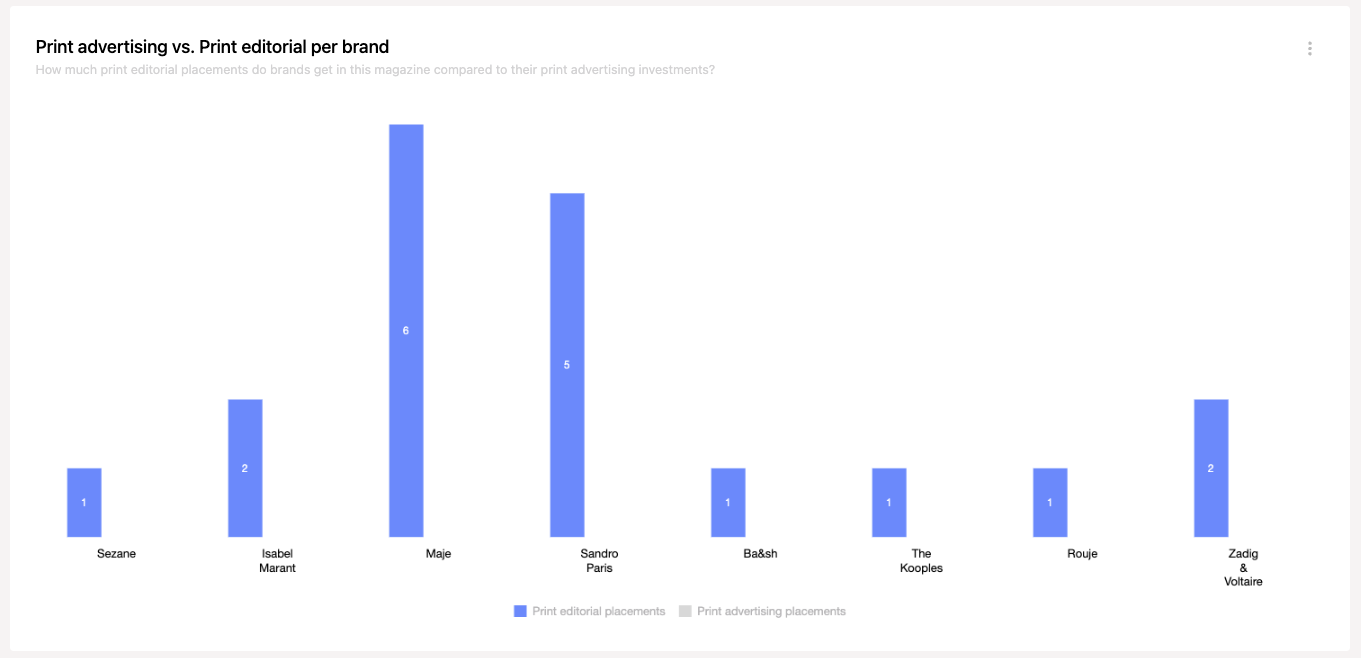
- The number of Print advertising placements vs Print editorial placements.
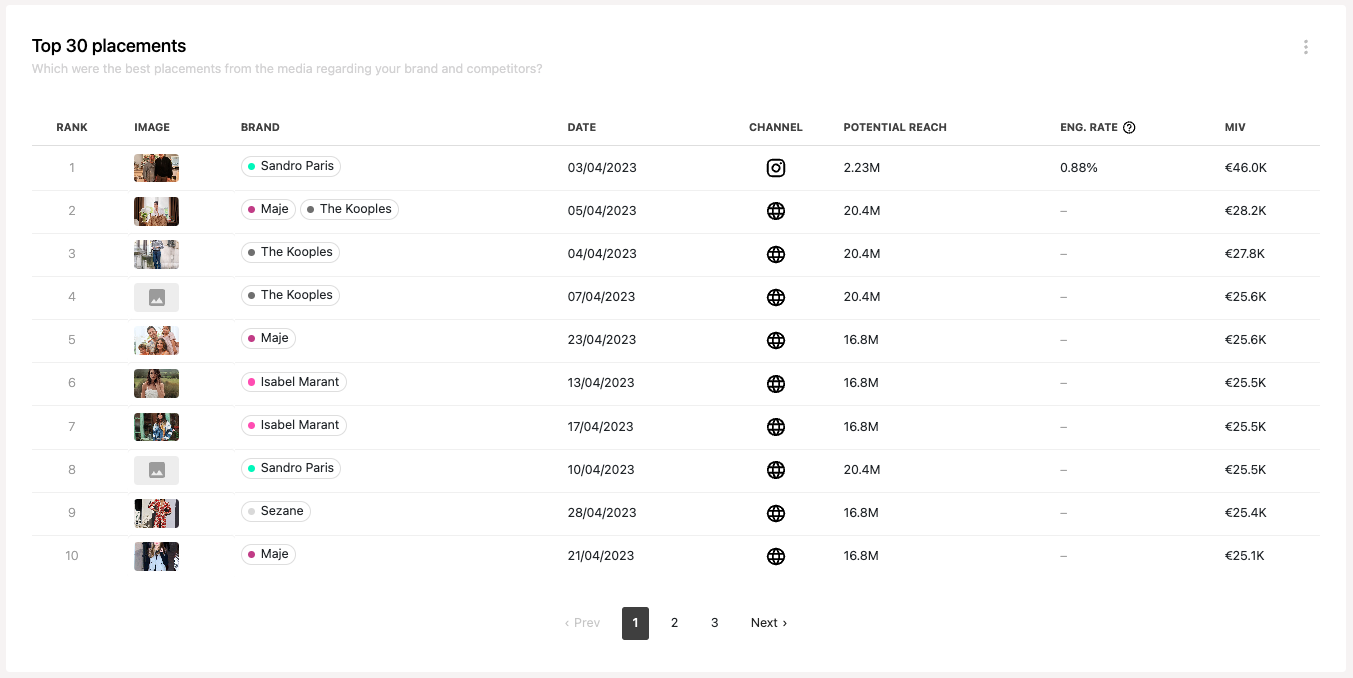
- The Top 30 placements in terms of MIV of the Voice selected.
Other articles
Industry Section : Compare the Media strategy of your brand with the all industry
Benchmark Section : Compare the Media strategy of your brand with your direct competitors
Brands Focus Section : Analyze the Media strategy by individual brand (yours and direcr competitors
My Dashboard : Build your dashboard to gather the most important metrics and access all your KPIs